This webpage is devoted to our Watershed Monitoring Program, initiated in 2018 under the leadership of QWA Board Member Dr. J. Kent Crawford. In August 2023, Kent stepped down from actively leading the program. At the current writing (summer 2025), the program is being jointly led by a group of five team leaders, as seen below.
The page has three parts:
1. Summary of Monitoring Program
2. Volunteer Monitoring Team & Map of Our Six Monitoring Stations
3. Data Collections
An accompanying page, "Monitoring Program Photos," houses photographs of our fieldwork and, on occasion, our work in the lab.
We also invite you to visit our freshly-created and still-in-progress QWA Water Quality Portal, where we are housing and making publicly available the data we are generating in our Monitoring Program, at http://quittiedata.org/ Just click on the image below:
1. Summary of Monitoring Program
The basic idea behind our Monitoring Program is to measure the extent to which the restoration work undertaken in the watershed is having its intended effects. Is the amount of sediment and silt being flushed downstream really declining? Are the macroinvertertebrates doing better after the restoration work has been completed? Is the water in the watershed really getting cleaner?
The long version of our Monitoring Program is detailed in our Watershed Implementation Plan (WIP) of August 2018, housed on the Studies & Documents page of this website. The relevant excerpt is here. Since then, due to lack of funding, we've had to scale things back while still undertaking a viable program that gets us the data we need. Our revised Monitoring Program, as detailed in a memorandum of 7 January 2020, is described in detail in this six-page PDF file dated January 7, 2020.
The short version was aptly expressed by Kent Crawford in an email to Michael (Josh) Lookenbill, Biologist and Monitoring Section Chief of PA-DEP dated 24 January, 2020:
"We have had to alter our plans significantly . . . and will execute the program using our own volunteer monitors. We have a plan to monitor:
1. Geomorphic status
2. Habitat conditions
3. Invertebrate communities
4. Water quality
"We will cover these components using volunteer monitors, college student interns, and the services of Dr. Rebecca Urban and her students at Lebanon Valley College, with PA-DEP providing lab support for our water-quality analyses. However, we no longer need the streamflow monitoring equipment. We have secured funding from the Lebanon County Stormwater Consortium to purchase the equipment we need. However, we are in need of two or three multi-parameter water-quality sondes to support our water-quality sampling. We need these instruments to measure four parameters;
1. pH
2. Specific conductance
3. Dissolved oxygen
4. Temperature.
"A fifth parameter, turbidity, would be nice, but not required."
Much more might be said, but that's the gist of it.
For the much longer version, see Dustin Shull and Josh Lookenbill, eds., "Water Quality Monitoring Protocols for Streams and Rivers, 2018," Office of Water Programs, Bureau of Clean Water, PA Department of Environmental Protection, 11th Floor, Rachel Carson State Office Building, Harrisburg, PA 17105. PDF file, 5 MB, 415 pages.
Another valuable monitoring resource, published in Sept. 2021, is the Stories in Water Data StoryMap, created by the Susquehanna River Basin Commission. The StoryMap covers the entire Susquehanna watershed, but one can also zero in on data for the Swatara Creek watershed, into which the Quittapahilla watershed flows. Data for the Swatara Creek watershed can be here: https://www.srbc.net/portals/water-quality-projects/sediment-nutrient-assessment/sites/swatara-creek-near-hershey.html
QWA Training Videos for Volunteer Monitors
Streamflow Monitoring Training Videos by Kent Crawford. On Tuesday, November 2, 2021, Kent Crawford delivered a 36-minute instructional seminar on the physics & hydrodynamics of streamflow and water quality monitoring. The seminar was recorded on Zoom and is available to view on YouTube, here: https://youtu.be/1Xu7D7Nn4ZQ Nine months later, on Monday, August 8, 2022, Kent offered a slightly updated version of the same presentation, this one 33 minutes long and also accessible on YouTube, here: https://youtu.be/0h0589qi9PU
Water Quality Monitoring Training Video with Mark Hoger. In this 80-minute water quality monitoring training video, recorded Wed. Aug. 31, 2022, Mark Hoger, Water Program Specialist with PA-DEP, offers a detailed description of how to collect and process samples collected from local waterways and send them to the lab for analysis: https://youtu.be/mun7-laYZss
Macroinvertebrate Sampling Field Techniques with Tony Shaw. In this 12-minute video, Master Watershed Steward Tony Shaw demonstrates the most effective techniques for collecting representative samples of macroinvertebrates in small waterways. Filmed in November 2023 and housed on YouTube, at https://youtu.be/5iH1VjL_irU
Demonstration on Using the QWA's Water Quality Portal. In this 33-minute video recorded from a Zoom meeting held on June 25, 2024 and housed on YouTube, QWA members Alyssa Bellucci and Bob Connell demonstrate how to use our recently-created and still-in-progress Water Quality Portal: https://youtu.be/oo7jPNIIMKY Our Water Quality Portal is here: http://147.185.239.141/qwa/
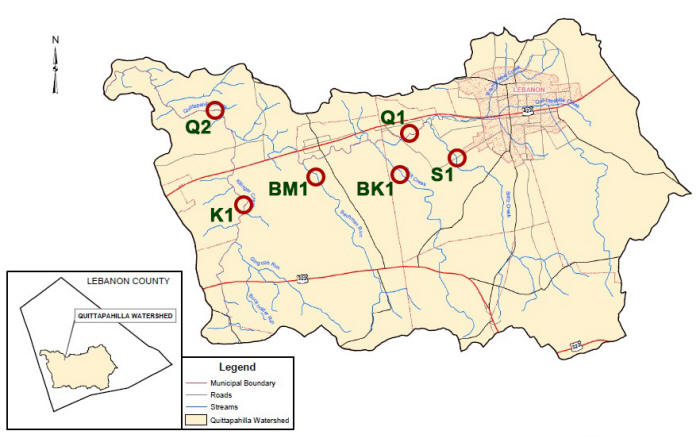
2) BK1: Beck Creek
at Bricker Lane
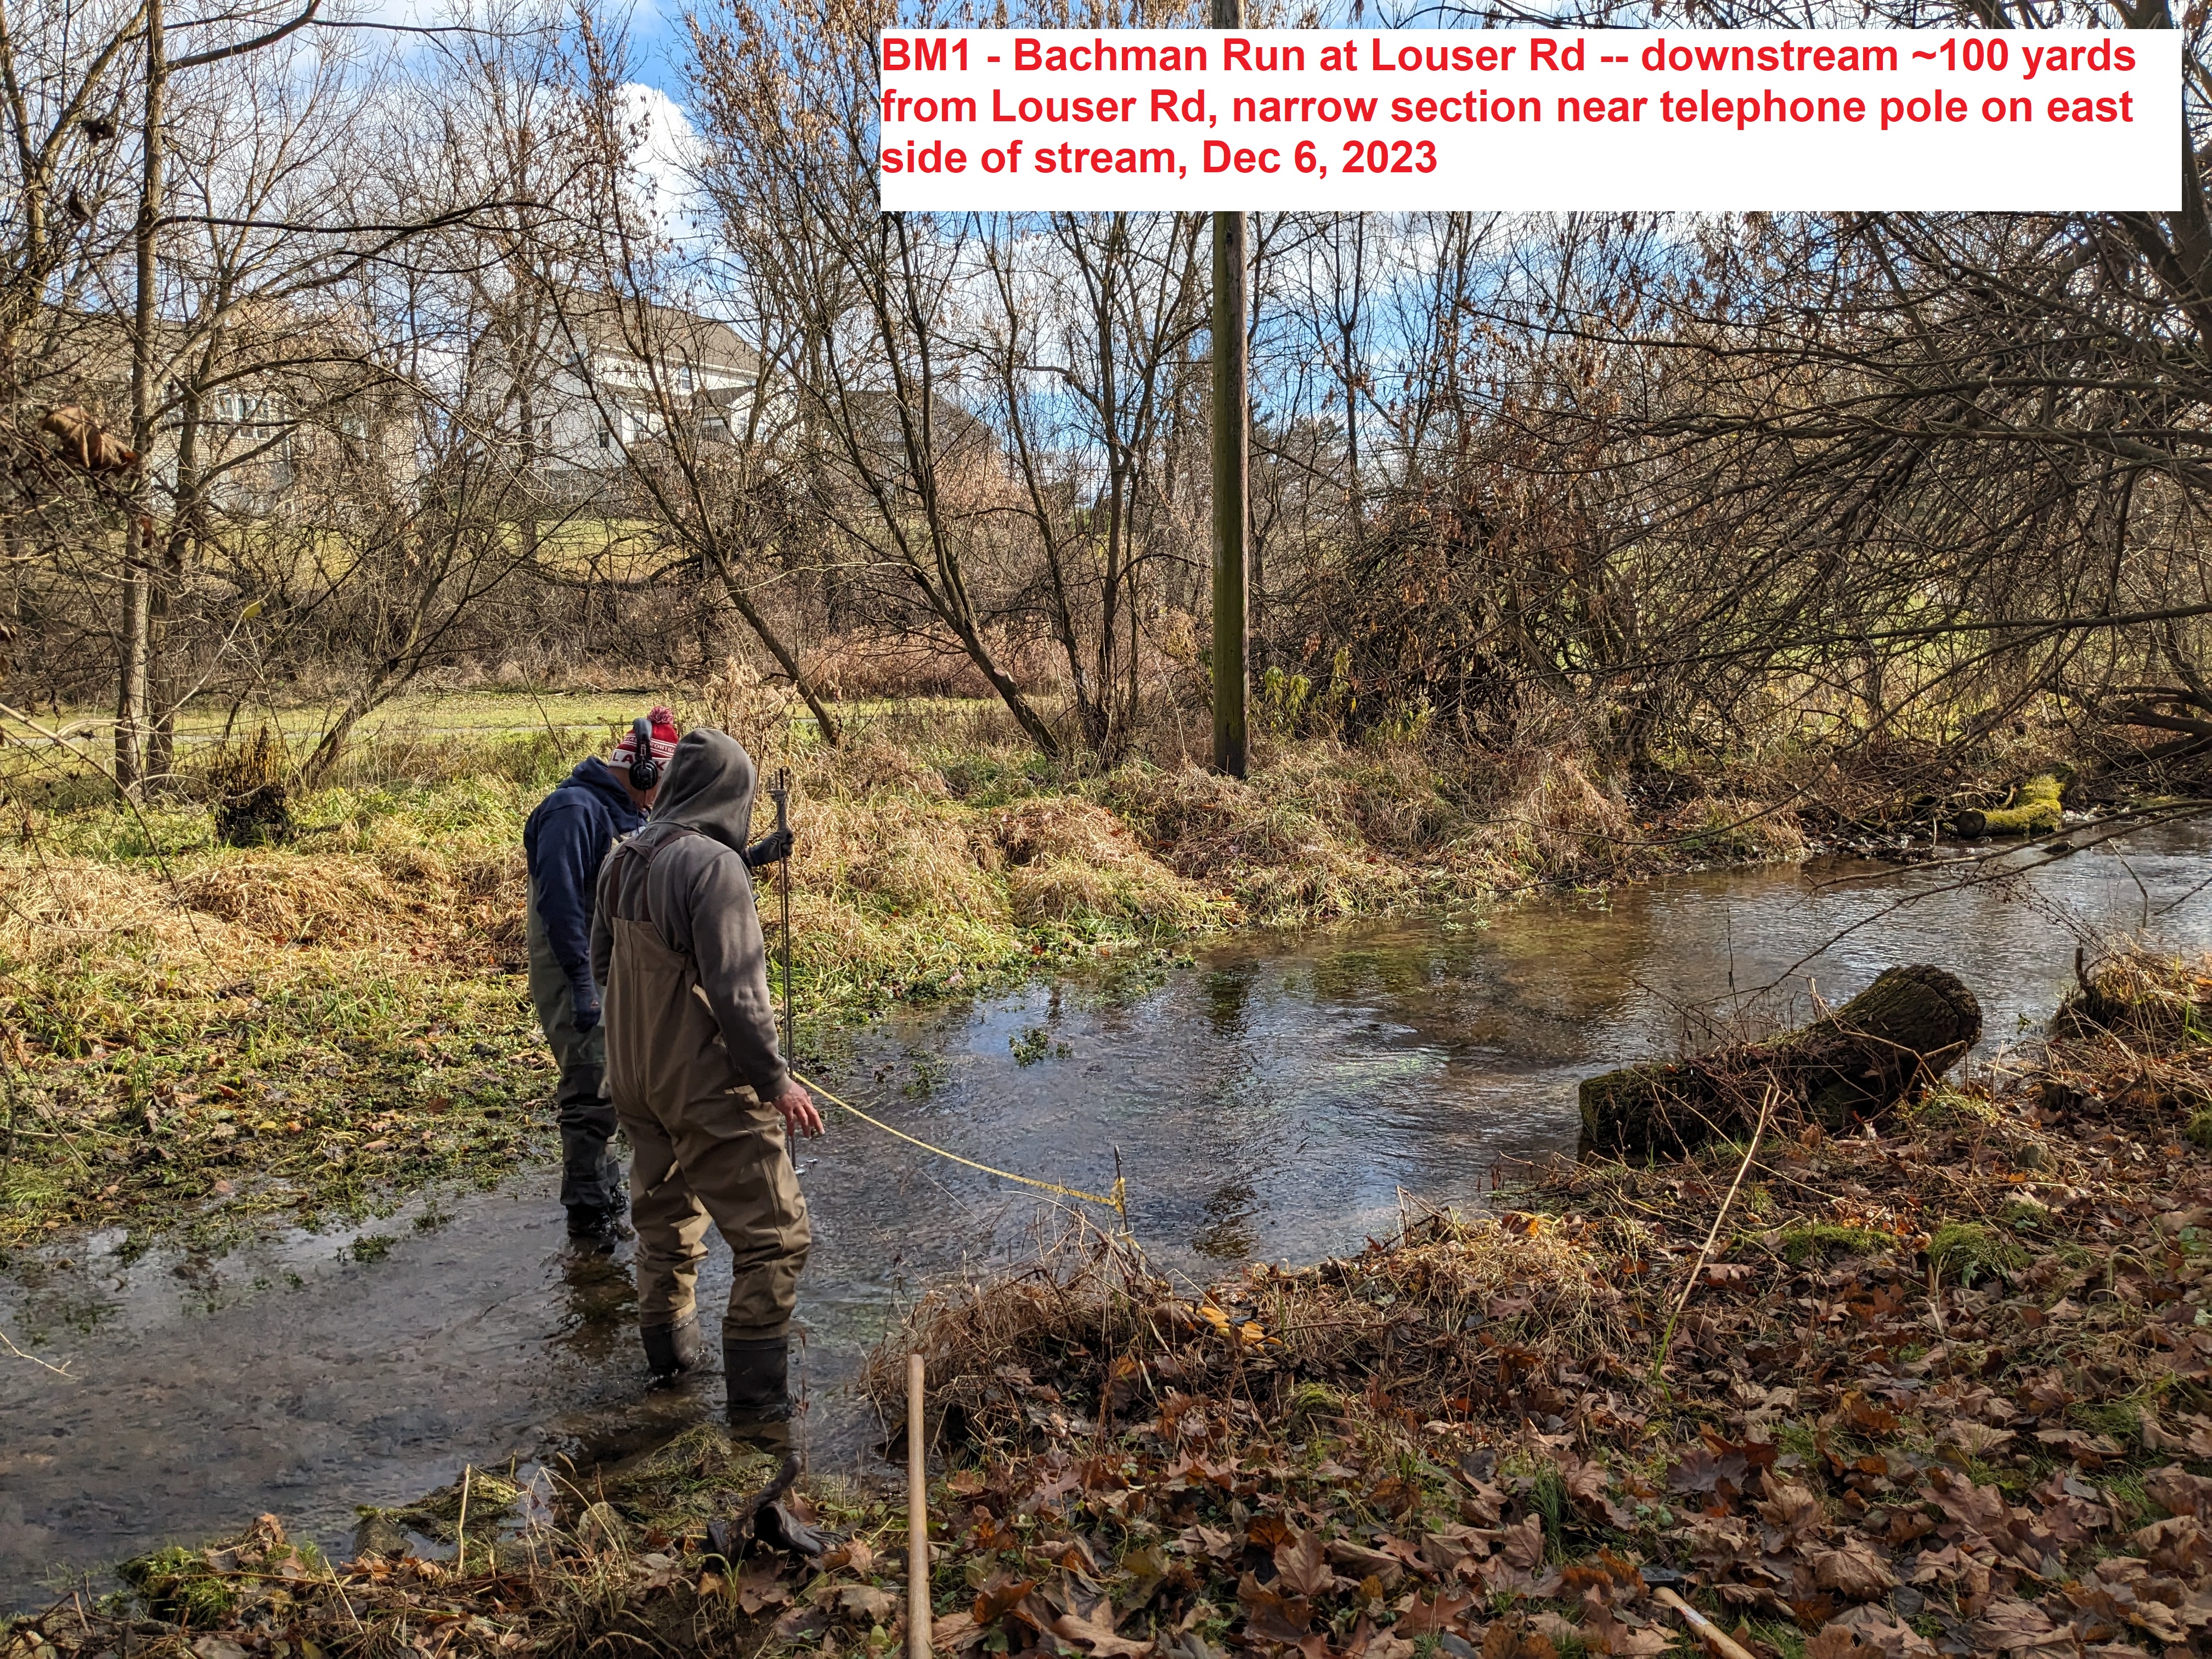
3) BM1: Bachman Run at
Louser Road
4) K1:
Killinger Creek at Killinger Road
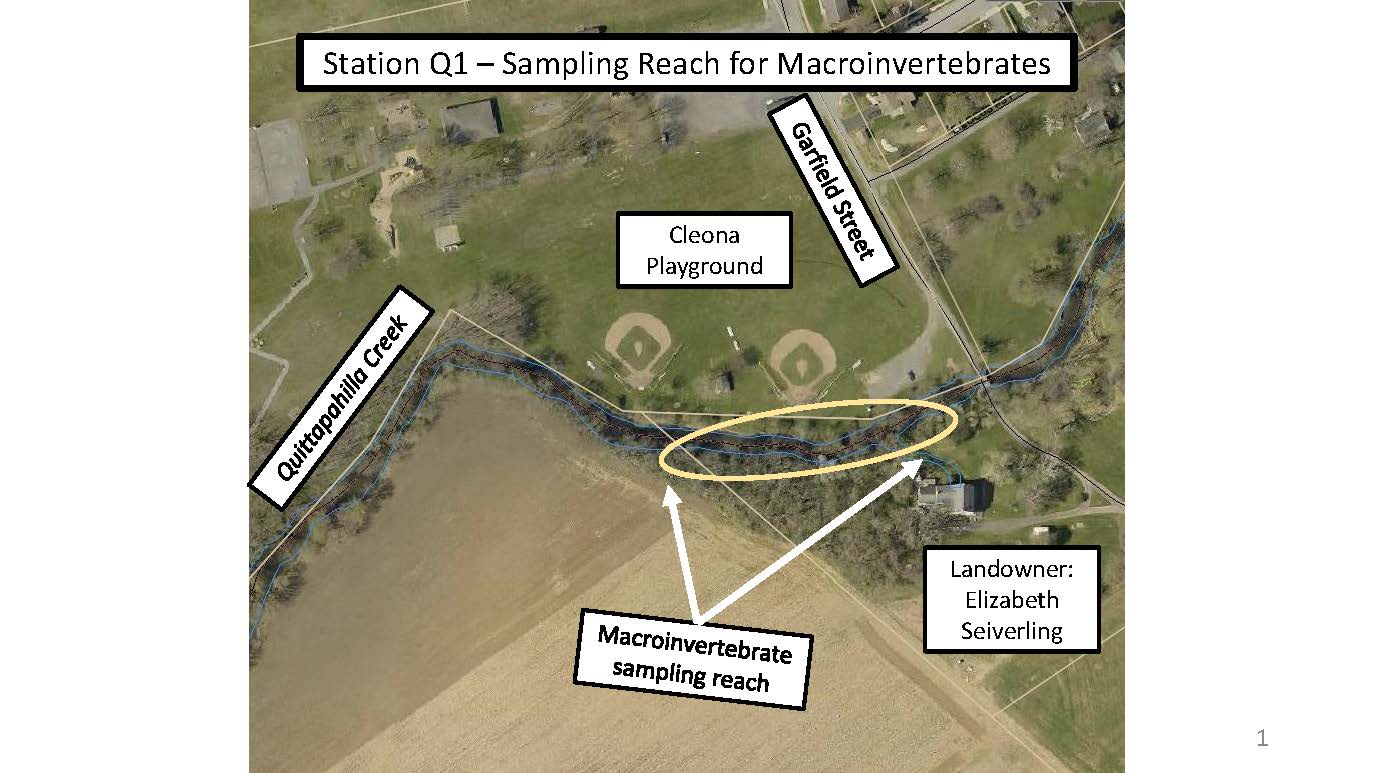
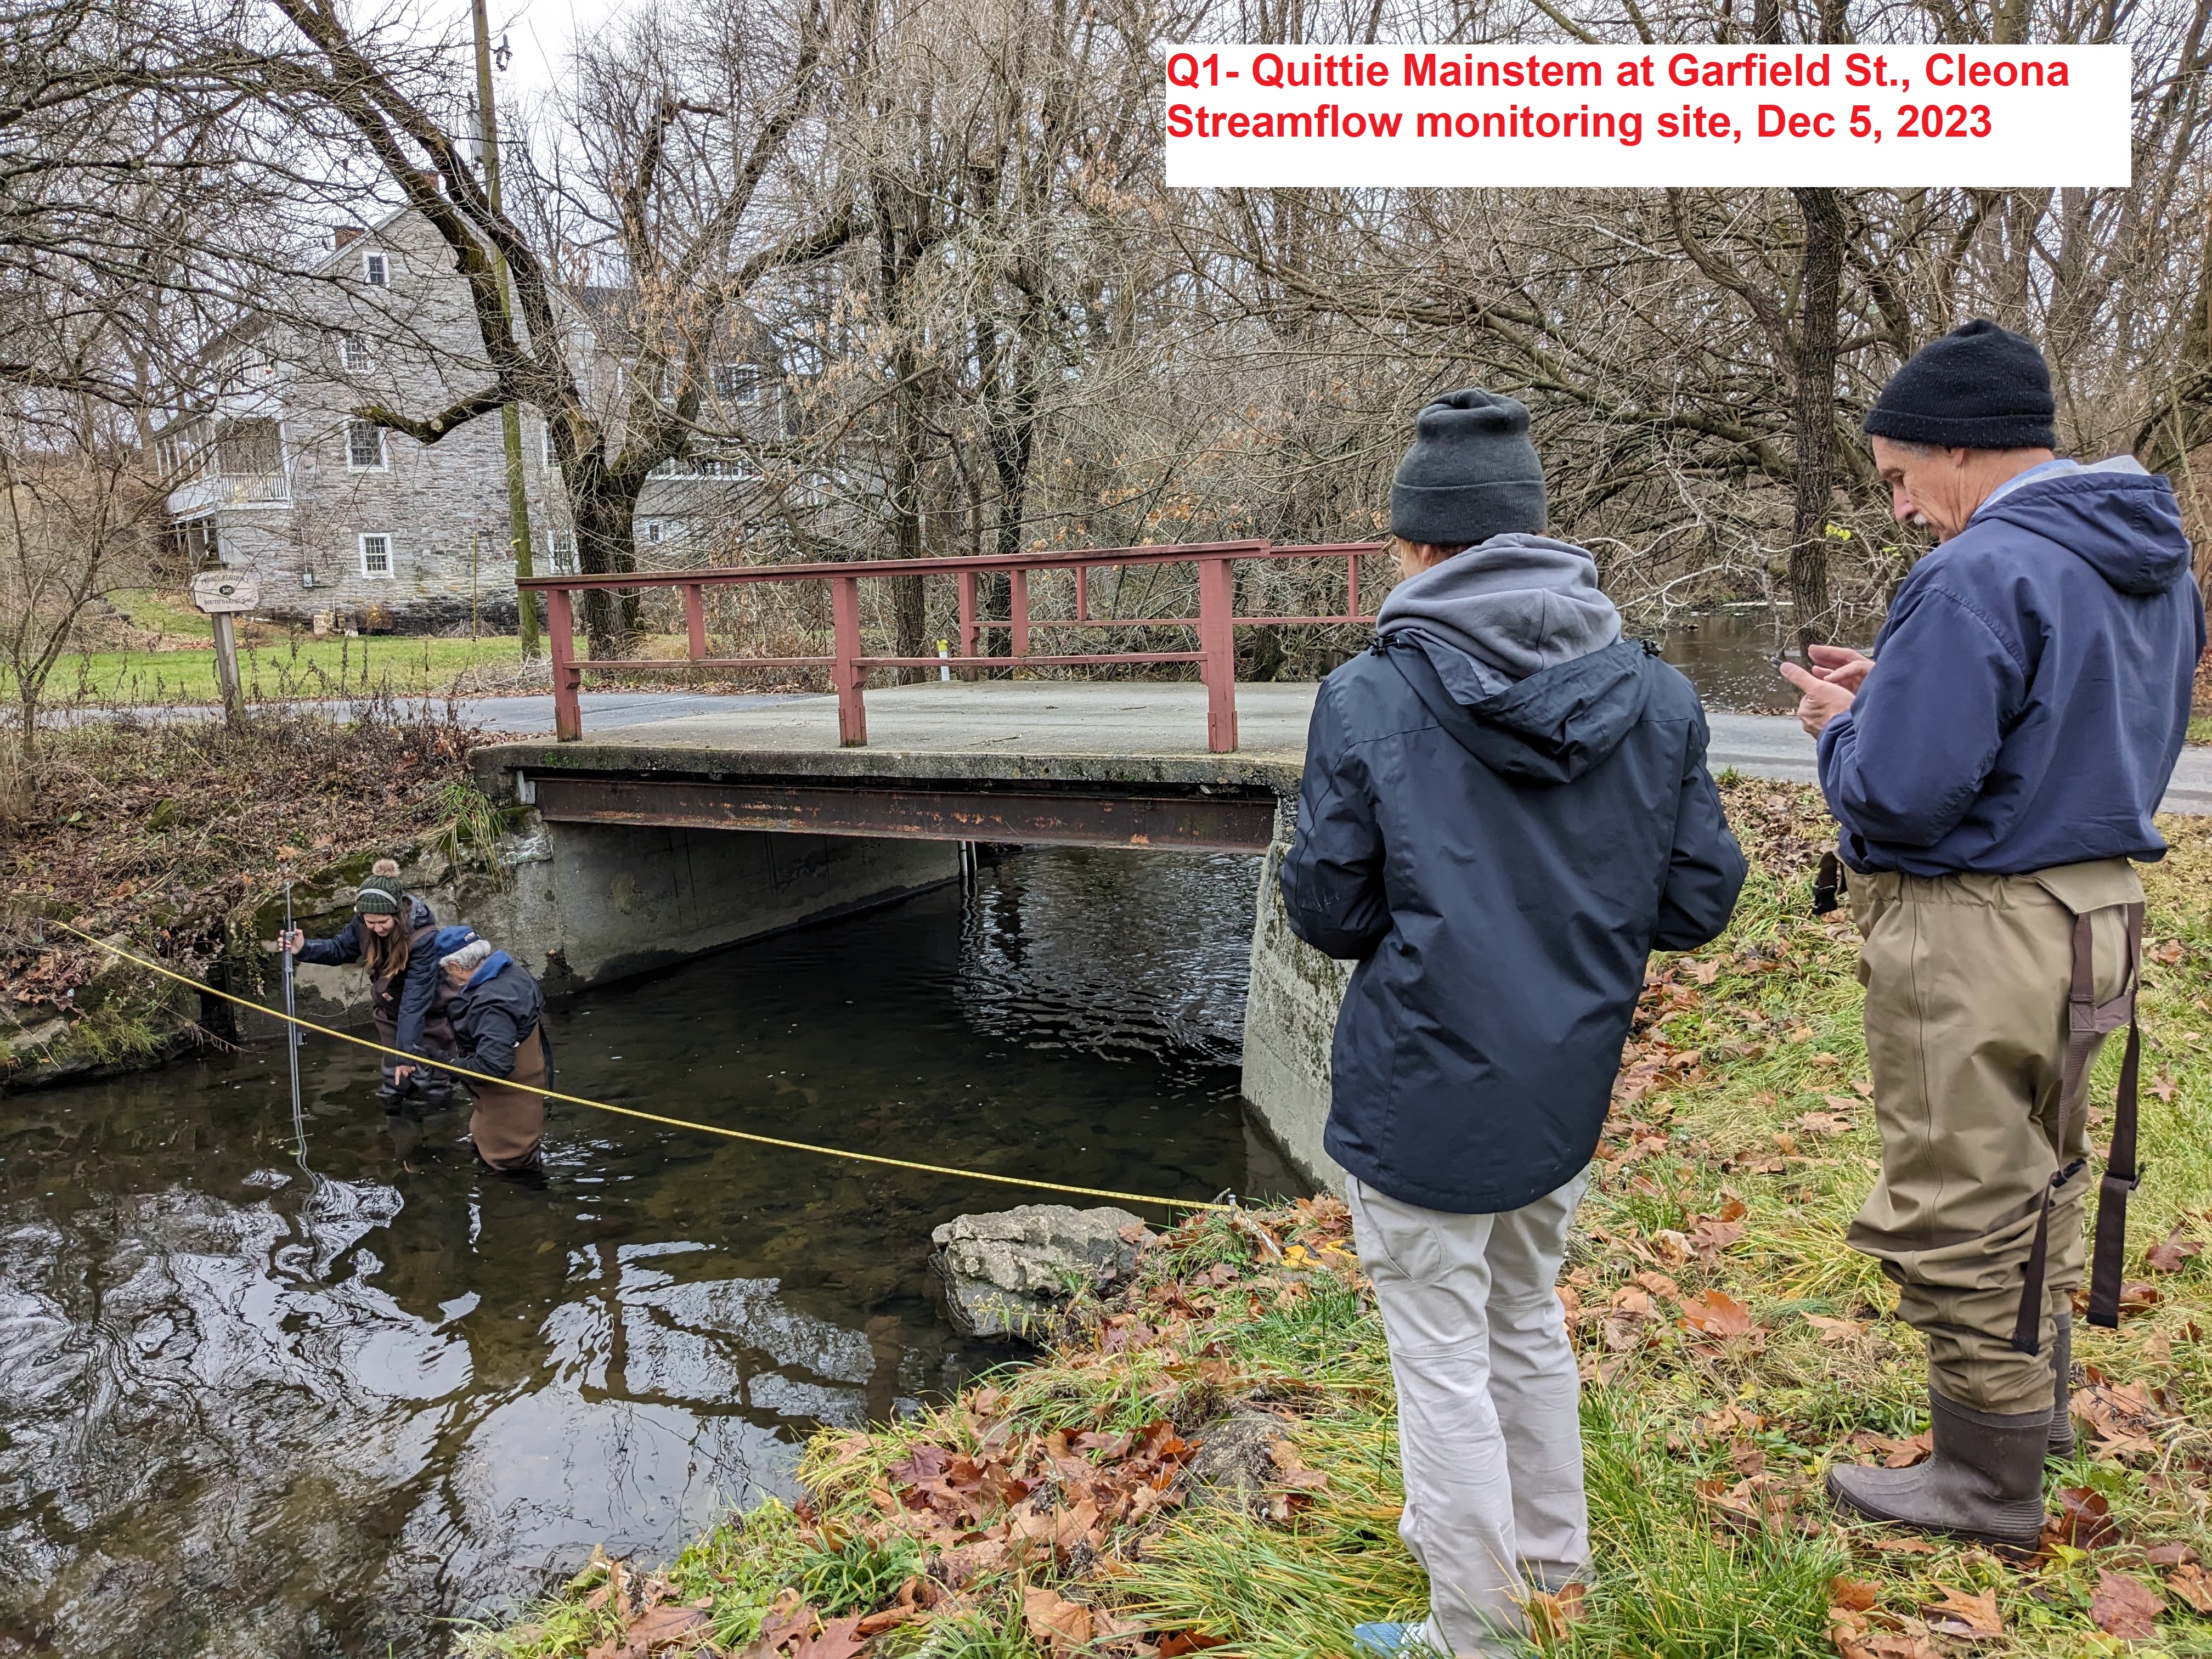
5) Q1:
Quittapahilla Creek at Garfield Street
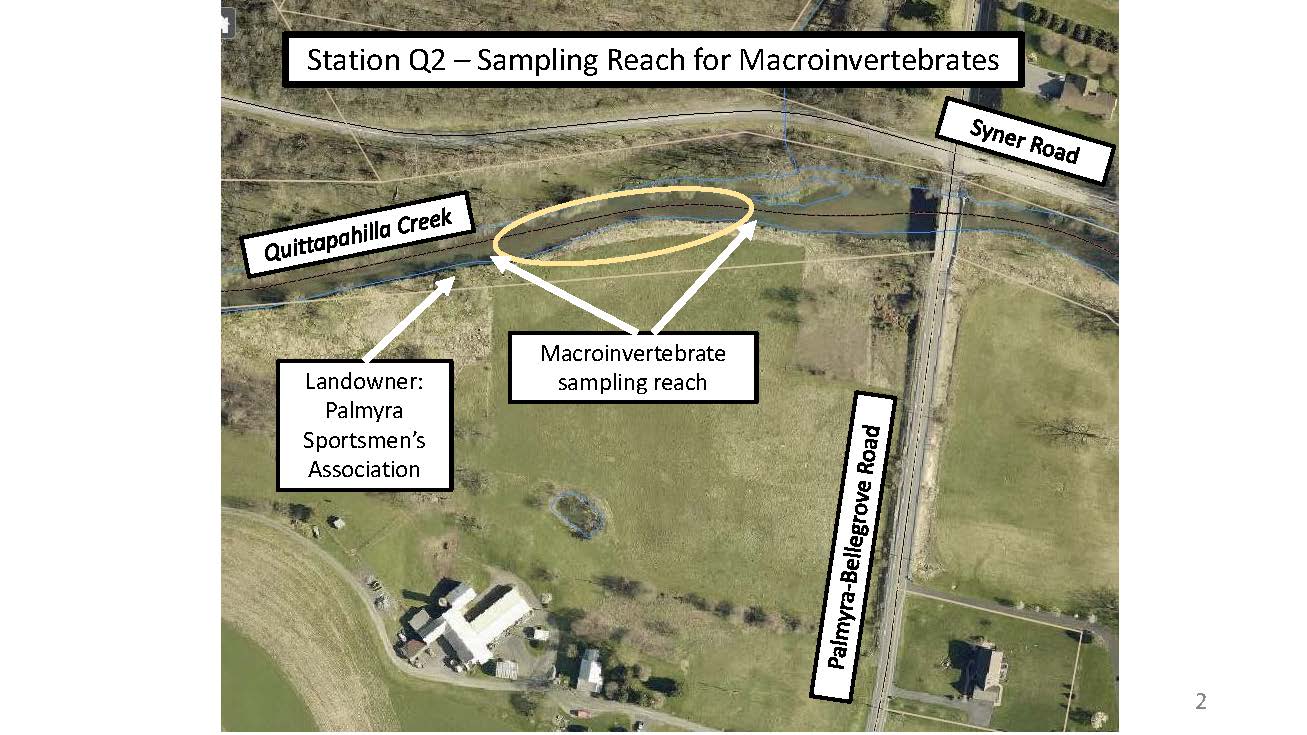
6) Q2:
Quittapahilla Creek at Palmyra-Bellegrove Road
Map of Our Six Monitoring Stations:
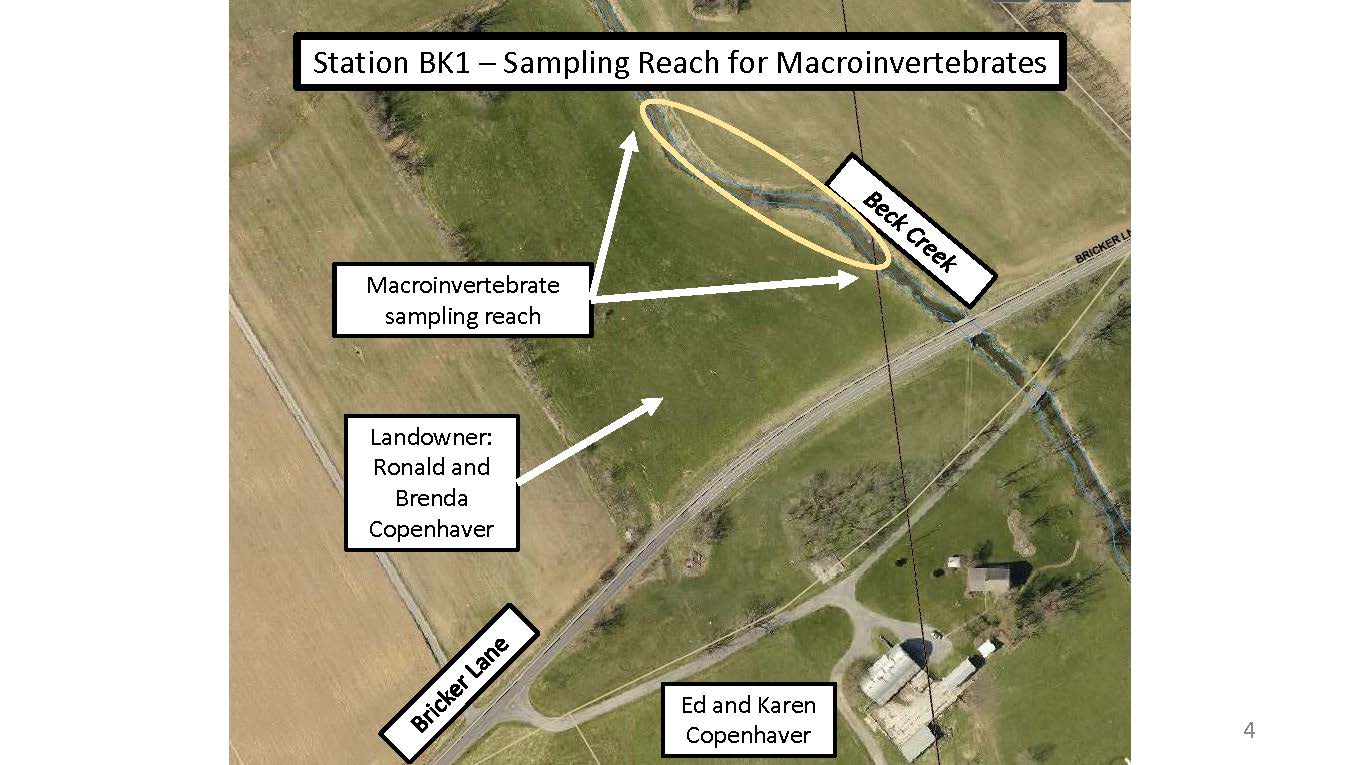
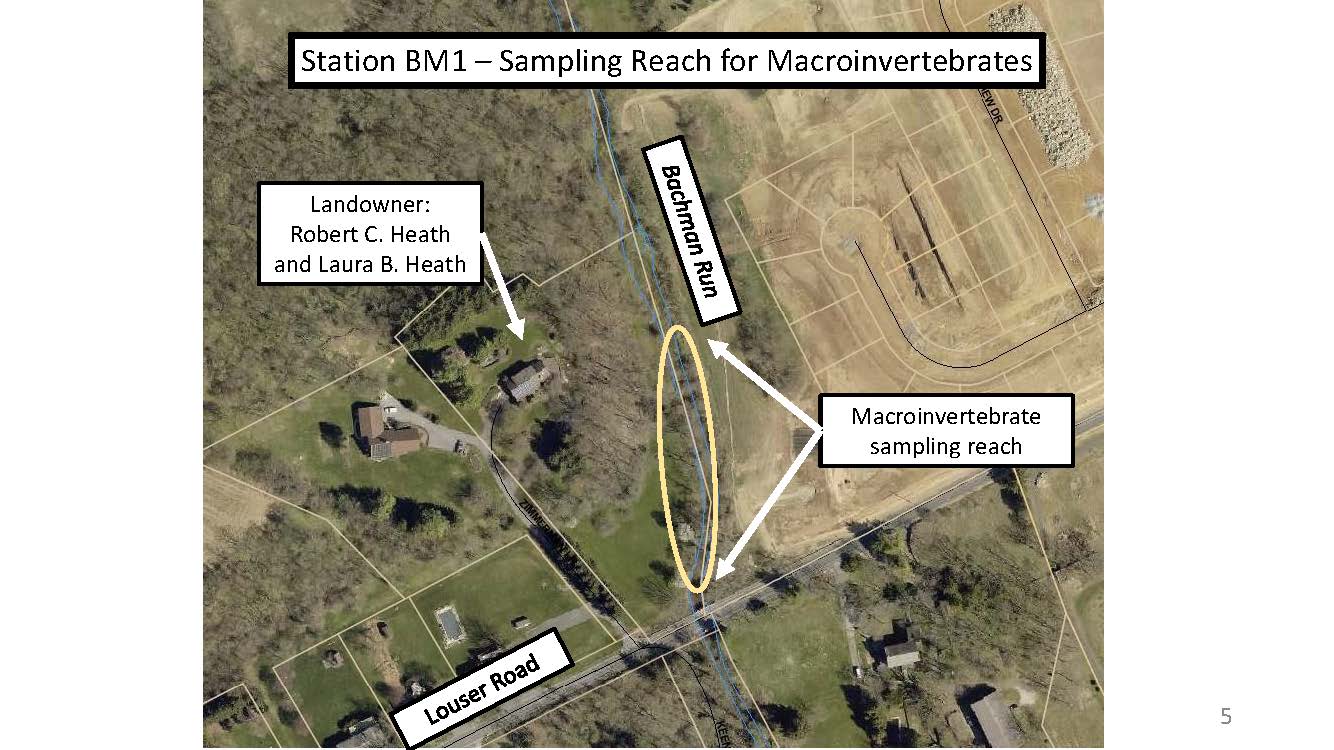
Aerial Images of Our Six Monitoring Stations & Macroinvertibrate Sampling Reaches
Aerial images of these six monitoring stations and the associated reaches for macroinvertibrate sampling, with roads and other landmarks indicated, appear on the images below. Click on the thumbnail to view the larger image:
 |
 |
 |
 |
 |
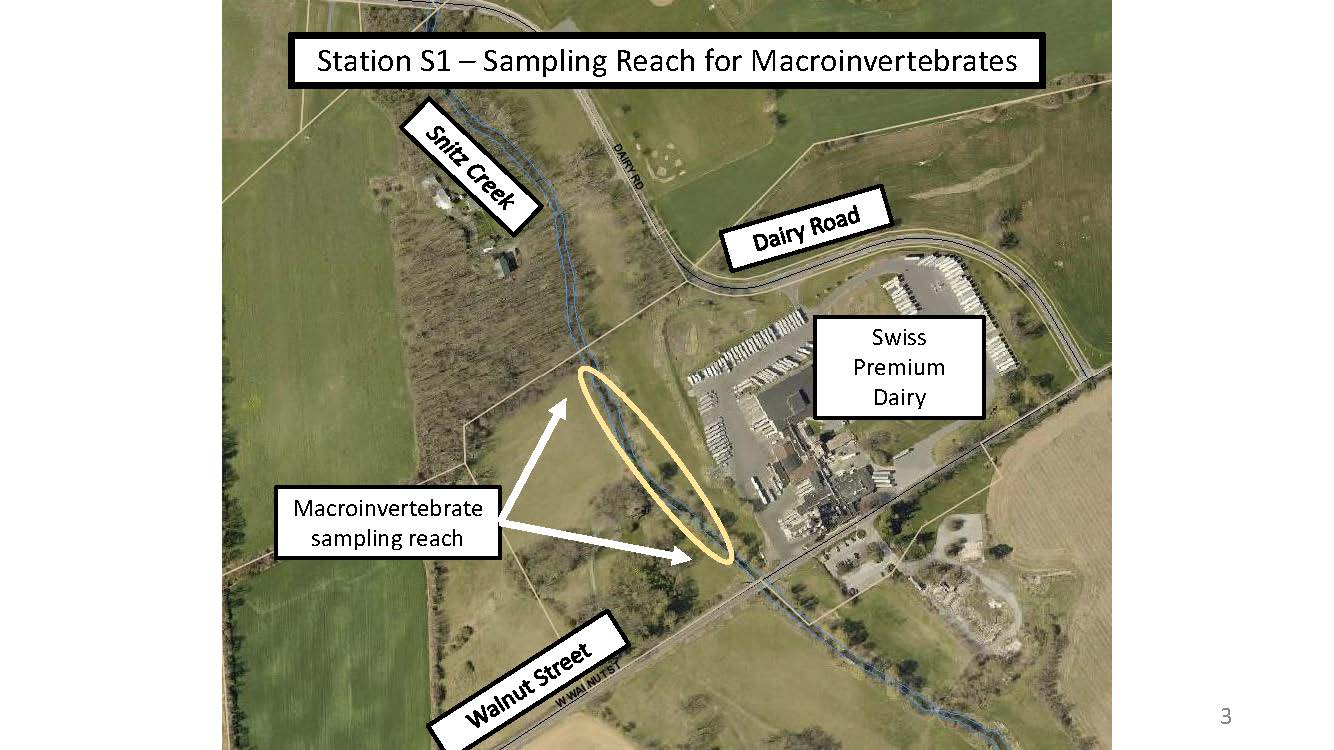 |
| Station BK1 | Station BM1 | Station K1 | Station Q1 | Station Q2 | Station S1 |
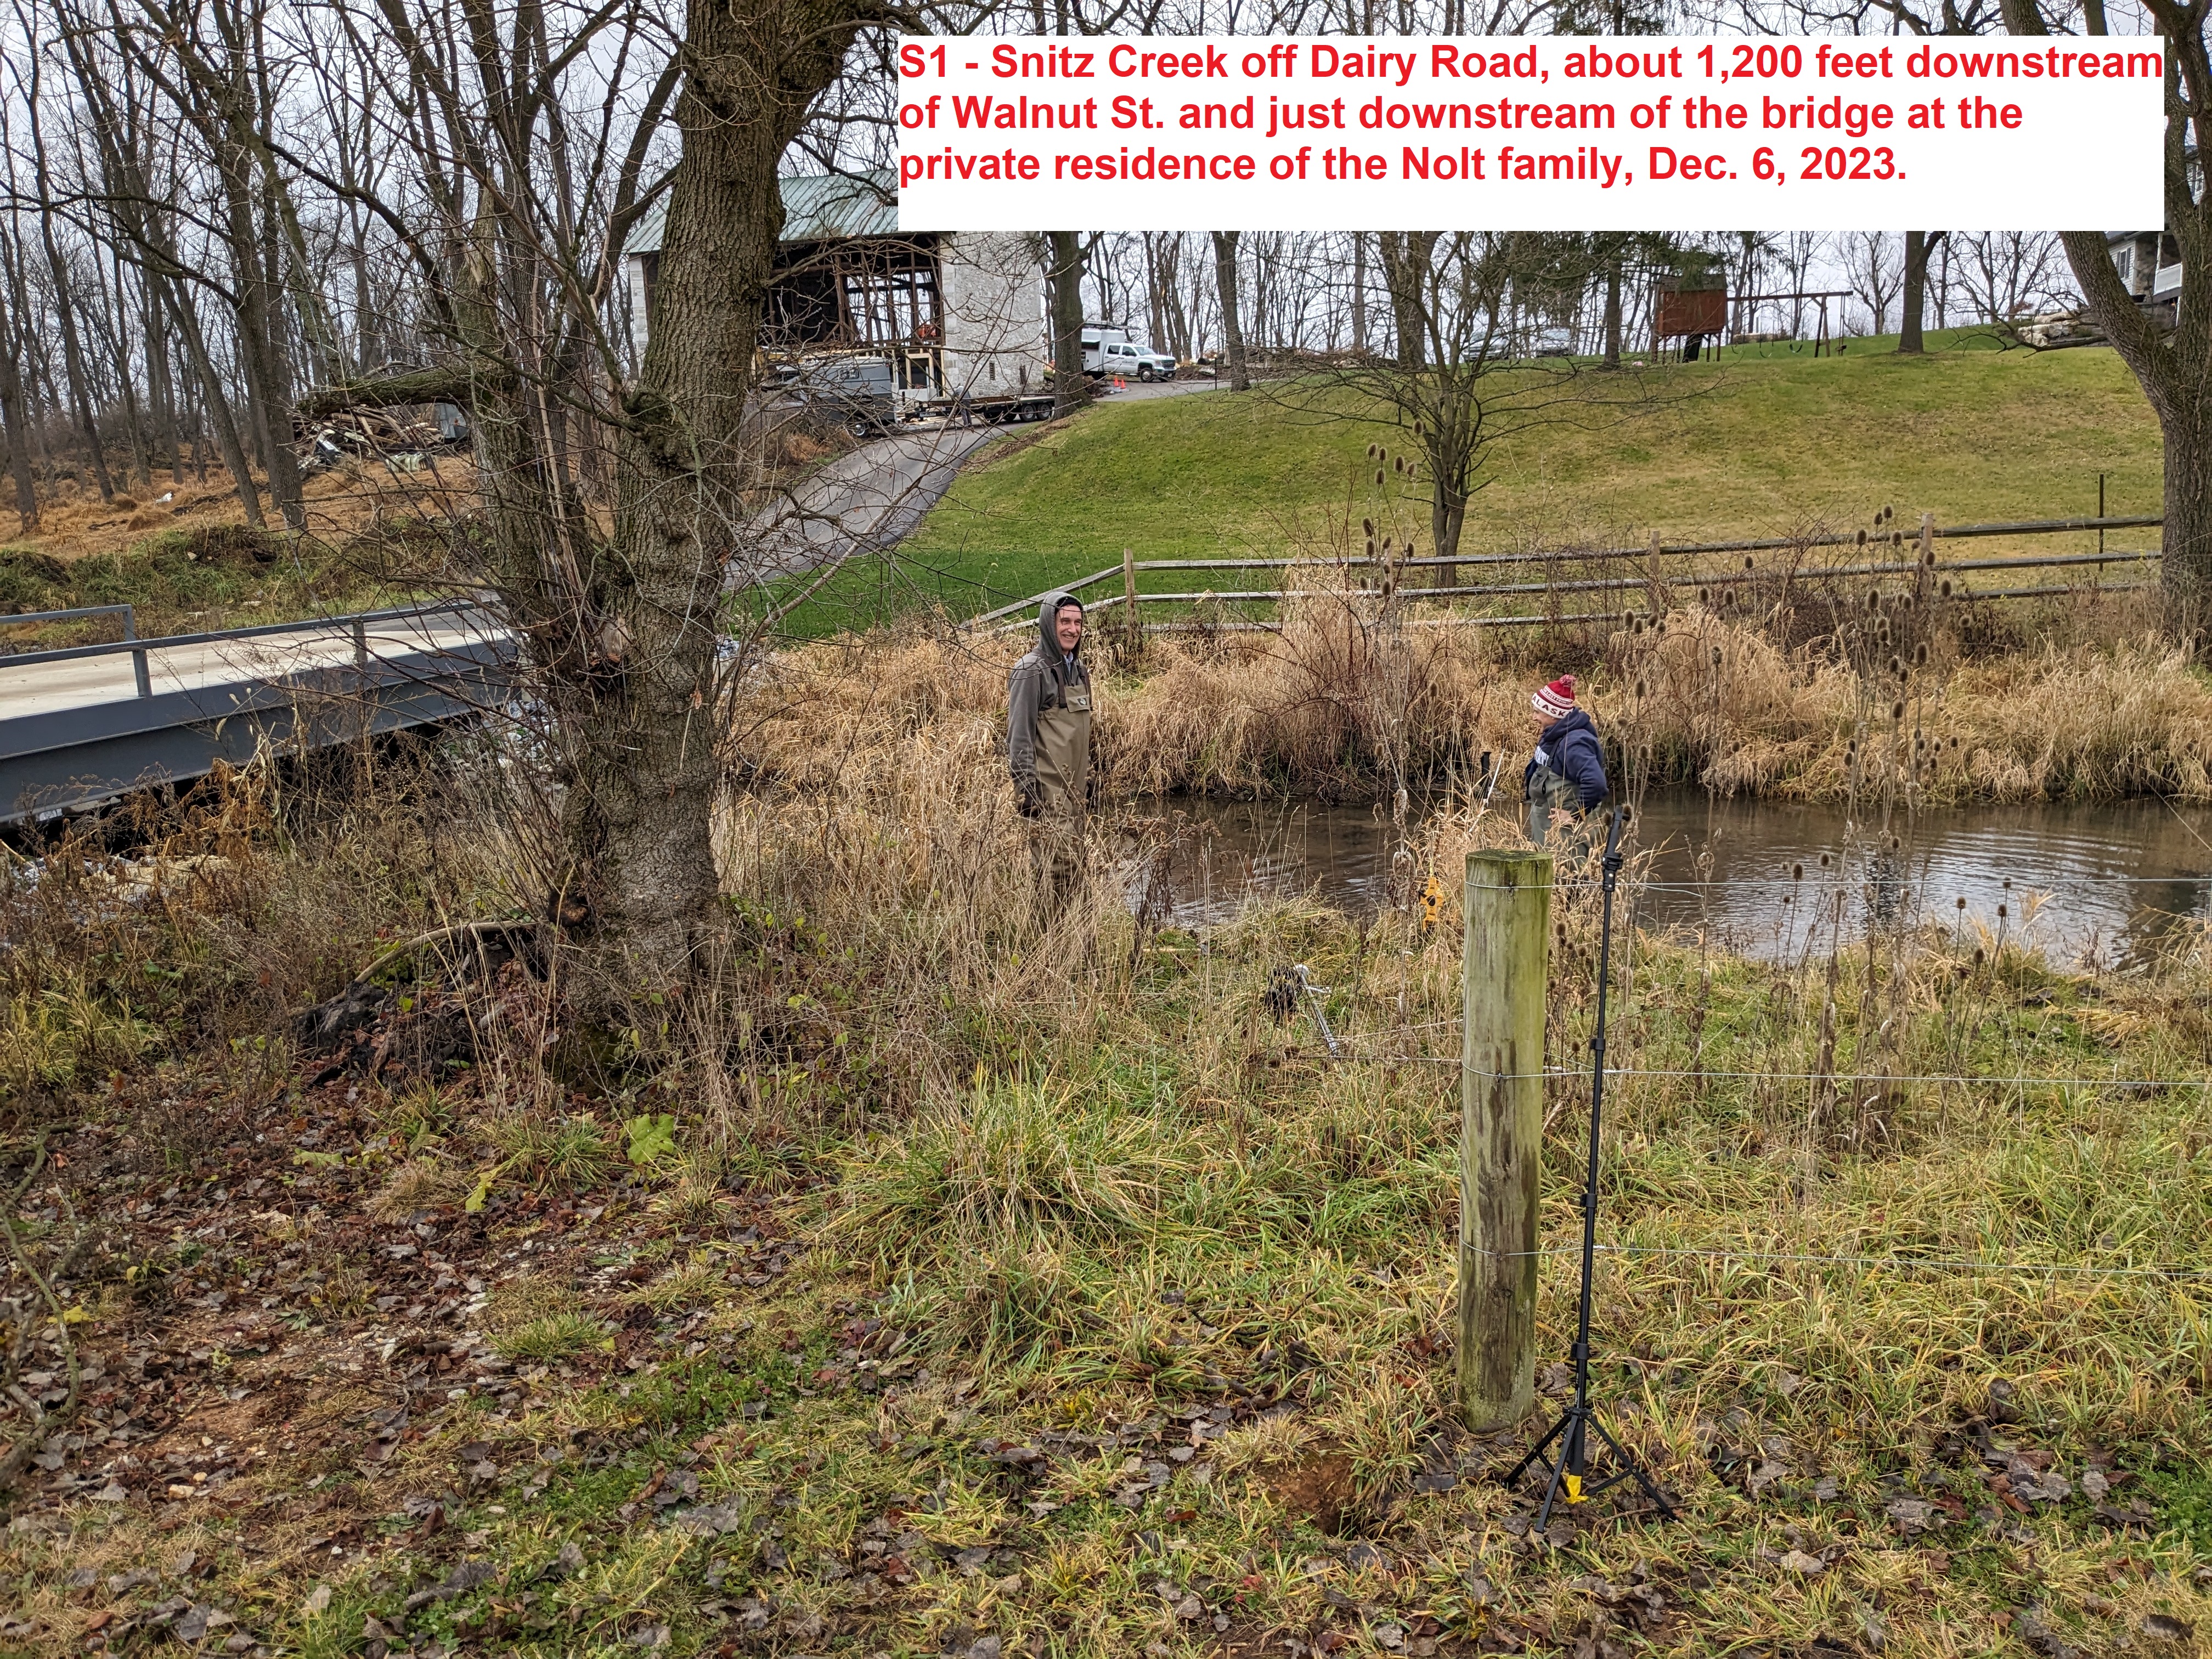
Photos showing exactly where we've measured streamflow in the past, so that subsequent measurements are taken in the same places. We won't measure streamflow at Station Q2 because there's a USGS streamflow measurement station there from which we'll get our data. And, we've not yet photographed the location at K1 because the flow in Killinger Creek has been too slow to measure. Click on thumbnails to view larger images.
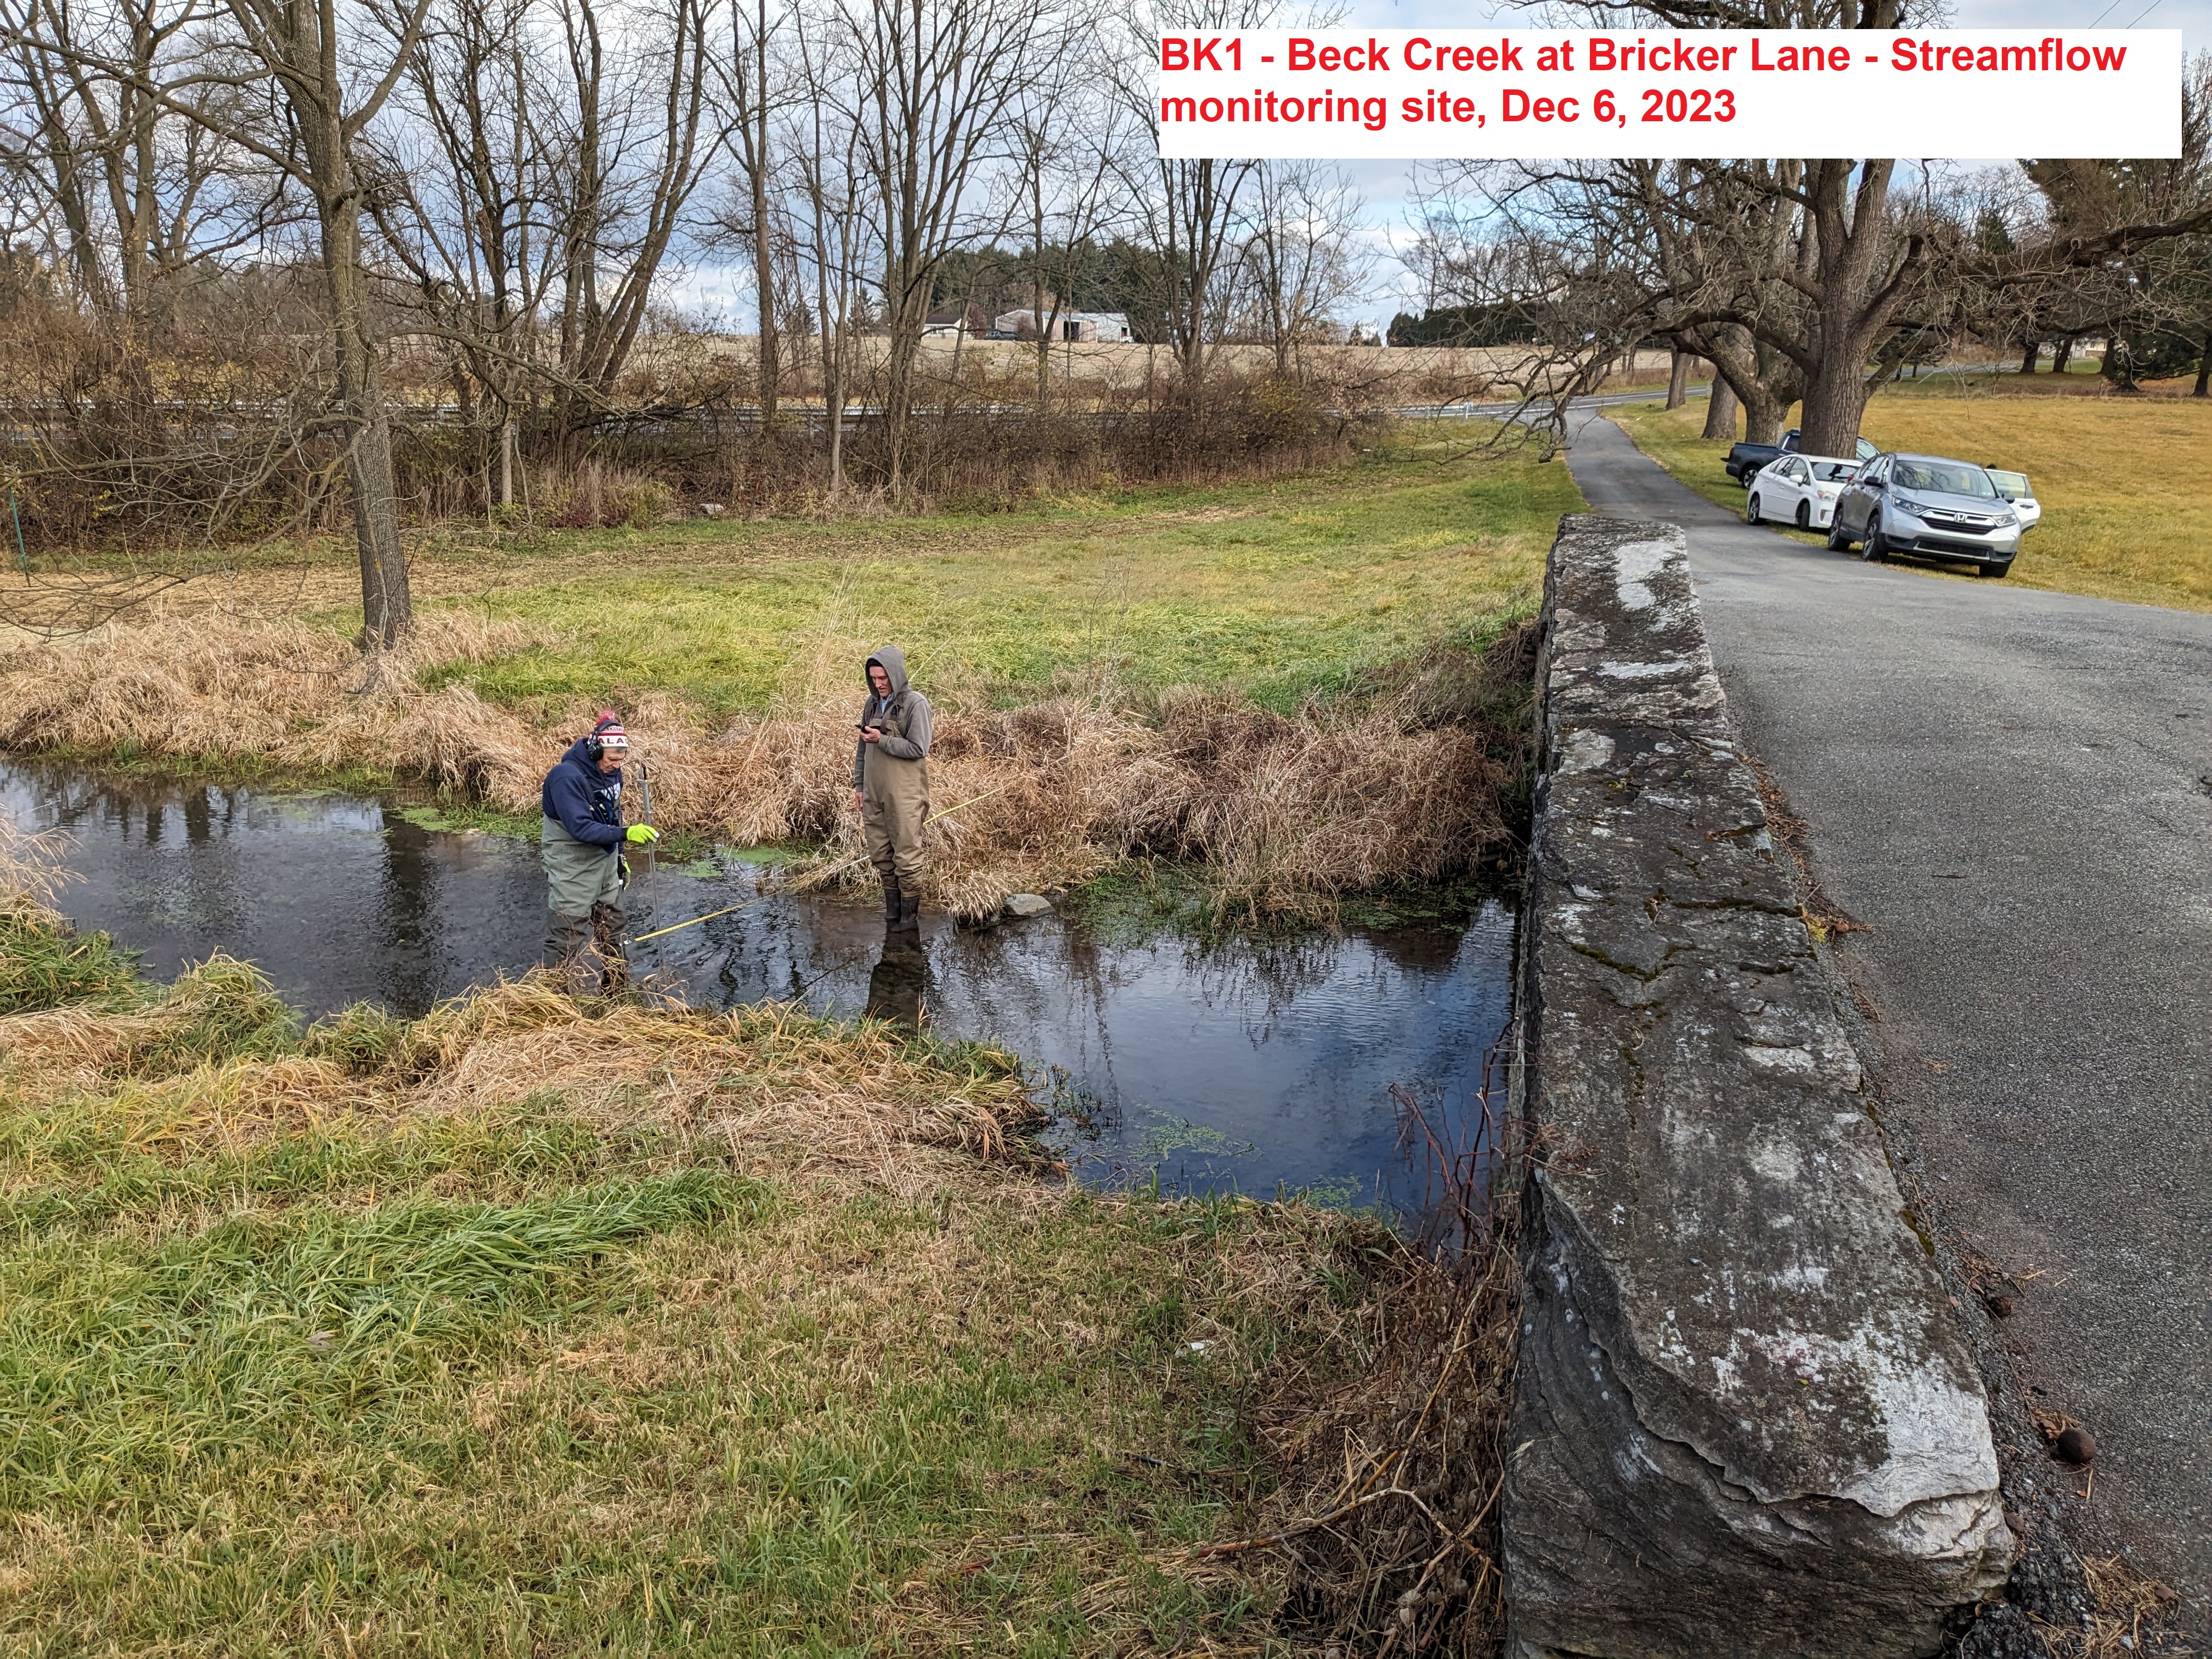 |
 |
forthcoming |
 |
USGS Station at Palmyra-Bellegrove Rd. |
 |
| Station BK1 | Station BM1 | Station K1 | Station Q1 | Station Q2 | Station S1 |
Monitoring Program Team Leaders, as of September 2025:
• Alyssa Bellucci and Bob Connell, Data
Managers
• Katie Hollen, Field
Coordinator (Leb. Co. Conservation District)
• Kara Lubold, Equipment
Manager (Leb. Co. Conservation District)
• Michael Schroeder,
Communications Coordinator
Additional key participants in our Monitoring Program include:
• Dr. J. Kent Crawford,
former Monitoring Program Coordinator
• Dr. Becky Urban, Professor
of Biology at Lebanon Valley College
• David Etheridge
•
Dale Mackley
• Trip McGarvey
• Lydia Mohn (LCCD)
• Stephan Vegoe
• Chad Weber
At the current writing, we have only a small amount of
data collected and ready to present here.
On August 14-15, 2023,
volunteers collected water samples at our six
monitoring sites and took them to the PA-DEP's
laboratory in Harrisburg, where they were tested for
a wide range of elements and compounds. Five
of those test results appear below; the sixth is
forthcoming. As expected, the test results
show high concentrations of dissolved nitrogen and
phosphorus. Happily, the samples show low
concentrations of heavy metals. Links are to
small PDF files (>1MB).
BK1: Beck Creek at Bricker Lane
BM1: Bachman Run at Louser Road
K1: Killinger Creek at Killinger Road
Q1: Quittapahilla Creek at Garfield St.
Q2: Quittapahilla Creek at Palmyra-Bellegrove
Road
In fall 2023, our Data Manager Alyssa Bellucci created a series of folders on Google Drive to house our growing body of data. Since then, this corpus of data has grown substantially. We are currently working to make these data publicly available through our Water Quality Portal.
At the September 16, 2025 QWA meeting, QWA member Bill Osburn offered a PowerPoint presentation titled “Quittapahilla Creek near Bellegrove, PA: Nutrient & Sediment trends,” on using statistics to better understand the monitoring data the QWA is producing. A pdf file of that presentation is accessible here.